Online Eye Testing at CEDS
There are some special eye charts that are used for various other purposes than the Snellen chart is!
The first one of these special eye charts is the astigmatic mirror that is used to diagnose and reduce astigmatism. Here is the chart (credit: www.i-see.org):

If an astigmatic looks at the lines near the center, some of the lines look darker in some directions than others.
A typical astigmatic will see the lines near the horizontal clearer and darker than the vertical ones. Horizontal lines may look spaced wider than the vertical ones, too!
Also the inner circle may not look quite round in shape.
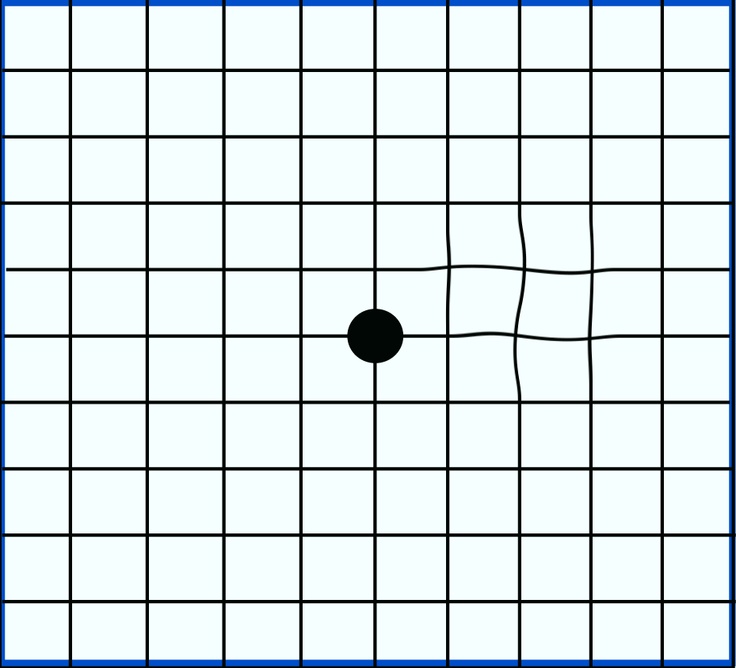
Another one of the special eye charts is the Amsler Grid that is simply a square mesh of horizontal and vertical lines looking like this (credit: www.nei.nih.gov):
Focus one eye at the dot in the center.
can u see the dot ?
can u see the four corners ?
are all the small squares visible ?
is there any curving of lines ?

Here is the Amsler Grid as it might appear to a person who is afflicted with age-related macular degeneration (credit: www.nei.nih.gov):

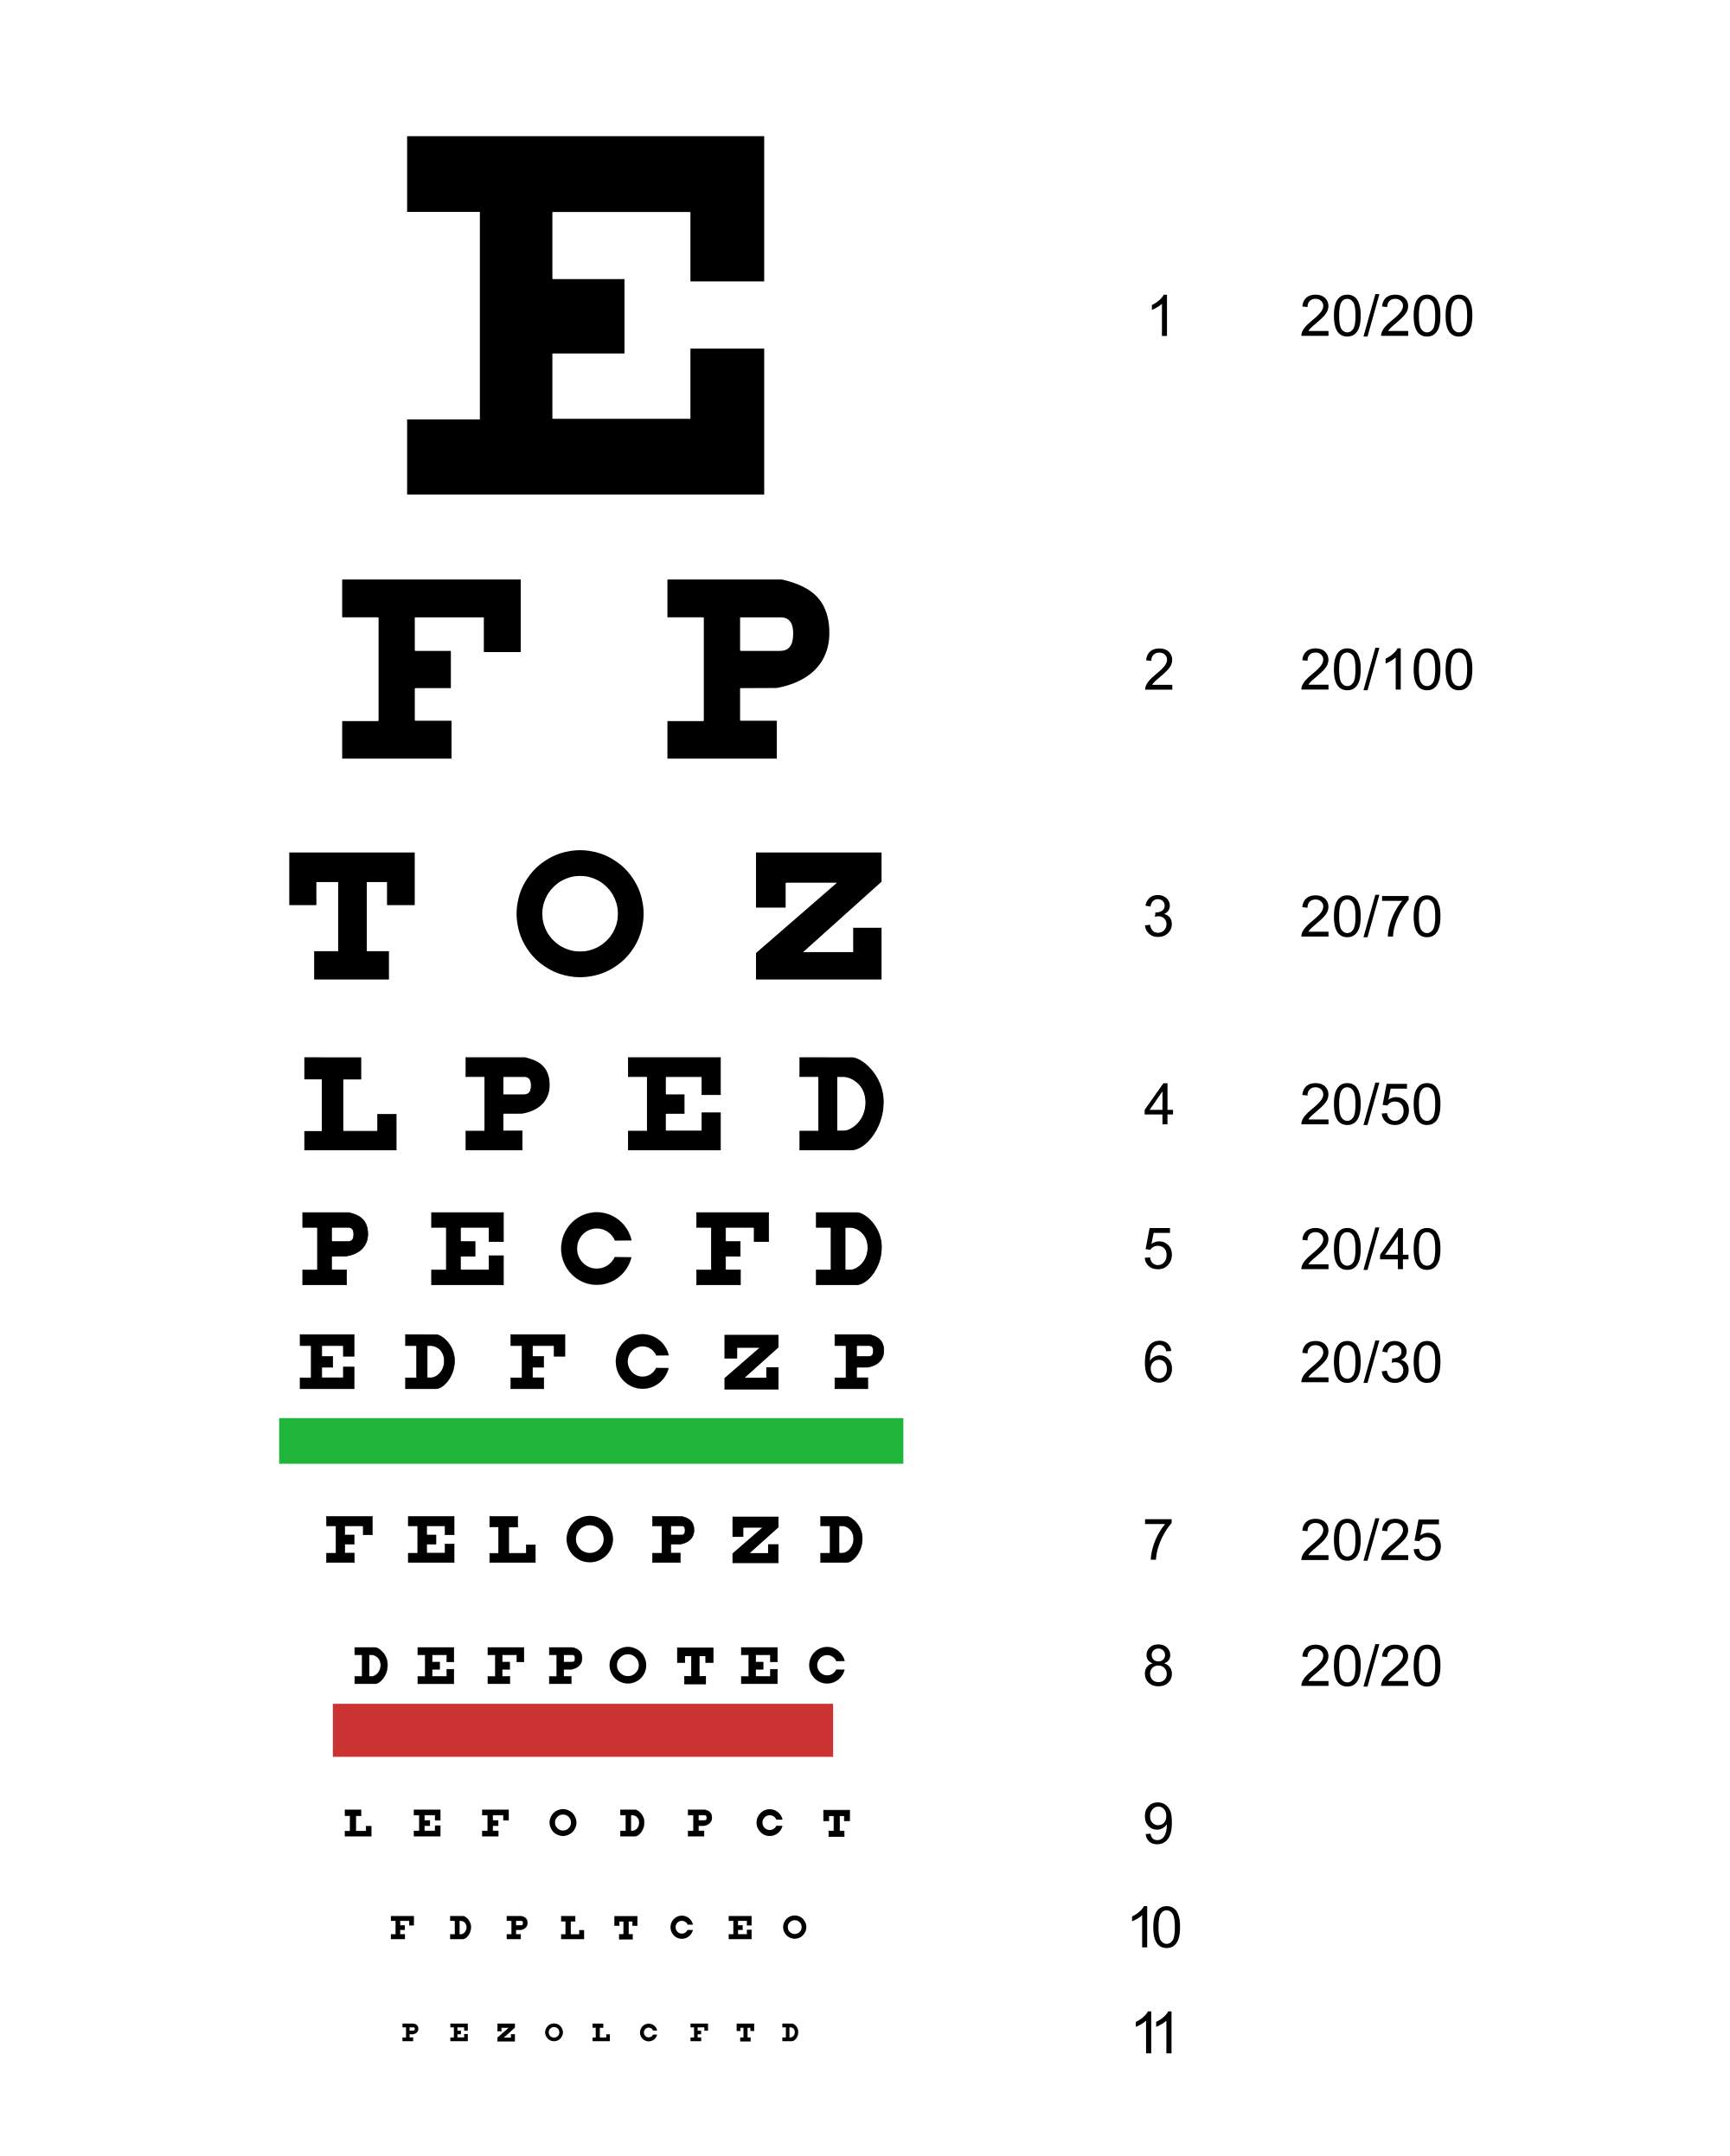
Here is another one of these special eye charts facilitating early treatment of diabetic retinopathy study (ETDRS) visual acuity chart (credit: www.nei.nih.gov):

What numbers do you see revealed in the patterns of dots below?
Next
 |
 |
Next
| Normal Color Vision | ||
|---|---|---|
| Left | Right | |
| Top | 25 | 29 |
| Middle | 45 | 56 |
| Bottom | 6 | 8 |
| Normal Color Vision | ||
|---|---|---|
| Left | Right | |
| Top | 25 | 29 |
| Middle | 45 | 56 |
| Bottom | 6 | 8 |
Another interesting color blindness test is below

The test to the left is simpler. The individual with normal color vision will see a 5 revealed in the dot pattern. An individual with Red/Green (the most common) color blindness will see a 2 revealed in the dots.

Can you read these sentences at 1 foot distance?
Nearly half of all blindness can be prevented.Everyone should have periodic eye examinations.
Nearly half of all blindness can be prevented.
Everyone should have periodic eye examinations.
Nearly half of all blindness can be prevented.
Everyone should have periodic eye examinations.
Nearly half of all blindness can be prevented.
Everyone should have periodic eye examinations.

Have your eyes checked, if you can't read first two sentences or find out the gap in the ring.
